Comparative Study of Medical Error Legislation in the League of Arab States (LAS). A proposal to Unify Medical error definition and its liability Legislations
Background
The concept of unifying medical error legislation offers multiple potential benefits to the League of Arab States (LAS).
Methods
This descriptive study examined LAS medical error legislation to highlight the current state of medical error legislation principles and proposes an approach that member states of the LAS could leverage to unify their regulations governing medical error.
Result
Among LAS countries, only 15 out of 22 (68%) had a specific medical liability law and only 12 of them (54%) defined medical error. The Civil and Penal Code was applied in 4 countries (18%) while information could not be found for 3 countries (13.6%).
Conclusion
The study recommends that LAS countries undertake medical error legislation reform to unify the definition, restrict criminal liability for actions prohibited by law, and limit medical error liability to corrective disciplinary and civil penalties (award), which will reflect positively in the healthcare system and practice of medicine.
Background
The League of Arab States (LAS) was established in 1945 to enhance mutual collaboration in economics, communication, peace, culture, social welfare, and health [1]. The organization includes 22 countries as member states from the Middle East and North Africa with similar legislative backgrounds. They applied the Ottoman Empire's “Kanun,” which stems from Sharia (Hanafi school of Islam - Madhhab Ḥanīfah), mandated by the Ottoman Empire when it was under its jurisdiction.
The codes were compiled into 16 books and published as one journal, known as MAJALLA AL AHKAM AL ADALIYYAH - The Ottoman Courts Manual [2]. However, during the twentieth century and in the aftermath of World War I, Egypt took the lead in developing its system of codified law. Subsequently, numerous other countries in the Arab region followed suit and embarked on the path of legal development. Many of these nations drew inspiration from Egypt’s legal framework, which was initially derived from the French legal system, while also incorporating the principles of Sharia [2]. Medical Liability Law is a specific subset of civil law that outlines standards for medical practice and addresses professional negligence or deviation from the standard of care, resulting in injury or damage to the patient. It also outlines penalties for failing to comply with the law [3]. Healthcare services vary among LAS countries; however, they are evolving and developing in most jurisdictions [4].
The Council of Arab Health Ministers was established in Cairo in 1975, with the primary objective of coordinating efforts to enhance healthcare services throughout the Arab world. The council aimed to foster collaboration in research, seeking unified solutions that would benefit the entire Arab region. Medical malpractice is defined as any commission or omission by a healthcare provider during management of a patient that deviates from accepted norms of practice and causes an injury to the patient, and internationally, it is addressed under the tort principle [3]. However, it is essential to note that medical error is the term used in all LAS countries to reflect medical malpractice. The definition of medical error, procedures for filing complaints, and penalties stipulated for committing medical errors that result in patient injury (medical malpractice) vary among countries within the Arab world. While all these countries uphold Sharia principles when formulating their laws, disparities arise when doctors from different Arab nations discuss medical liability of medical error and express concerns regarding the application of best practices, particularly fearing litigation when caring for high-risk patients where decisions are taken rapidly and under uncertainty, such as acute and emergency care. In these settings, the legal definition of medical error and liability may directly influence physicians’ willingness to act, assume risk, or initiate invasive but potentially life-saving interventions. Therefore; taking decisions urgency and time of contact with patients in consideration when assessing medical error is of important value which align with reasonable person standard theory rather than best care standard which is used for clinical trials, research and quality improvement purposes [5].
Overall, there is a prevalent fear of legal repercussions if patient outcomes are unfavorable. This descriptive study aims to compare the existing medical liability legislation for medical error across all LAS countries, outline the current state, and propose a set of unified medical liability of medical error principles that can be universally applied throughout the LAS countries.
Methods
A descriptive comparative legal analysis to compare the medical liability of medical error legislation across the LAS countries. The study aims to examine the legislation of LAS countries regarding the following criteria: the existence of specific medical liability laws, the definition of medical error, the legal responsibility applied to medical errors, the process of medical error litigation, penalties stipulated for medical errors, and the presence of a statute of limitations. A comprehensive web search was conducted to identify the medical liability legislation of each LAS country. The study authors conducted web searches in April-June 2023 for medical liability legislation in English and Arabic. A second search was conducted in March 2025 to identify any new legislation enacted since the initial search. The following keywords were used: medical liability Law, Health Law, medical error definition, medical malpractice, and medical negligence. To ensure a thorough understanding of the subject, the study authors reviewed published research papers and law school theses that delved into medical liability within each country. When the information was unclear, the study authors consulted practicing physicians in specific countries for legislative insights; their expertise and firsthand experience helped verify and supplement our search findings. The study primary data sources (official legislative and regulatory texts) and secondary sources (interpretative legal papers) analysis followed a functional comparative legal approach, focusing on how different legal systems regulate similar issues related to medical error and professional liability.
Results
Among LAS countries, only 15 out of 22 (68%) had a specific medical liability law and only 12 of them (54%) defined medical error. The Civil and Penal Code was applied in 4 out of 22 (18%) countries when medical error occur. Information was not available on 3 out of 22 (13.6%) countries. Data was extracted and summarized in five tables in an intention to provide a comparative analytical overview of legislative approaches rather than an exhaustive codification of national legal systems. [Table 1] provides an overview of the medical liability legislation across all 22 LAS countries. It indicates whether each country has a specific Medical Liability Law, along with the dates of issuance and the presence or absence of a specific definition of medical error. Additionally, it indicates whether the Civil or Penal Code is used to address medical errors in countries that lack specialized legislation. This was extracted from published literature about medical error litigation in these countries. Regarding the definition of medical error, some countries briefly mentioned it, while others explicitly outlined it. However, across all countries, the concept of negligence formed the basis for defining medical errors. A few countries provided further details by specifying the actions considered negligent. [Table 2] lists the definitions of medical errors, and the penalties stipulated for medical errors in countries with specific medical liability laws. In nearly all countries, criminal and civil penalties were mandated for medical errors. Disciplinary penalties were stipulated in some of the medical liability laws examined however not in details as likely it is addressed in regulations governing practicing medicine and licensing in each country [Table 2].
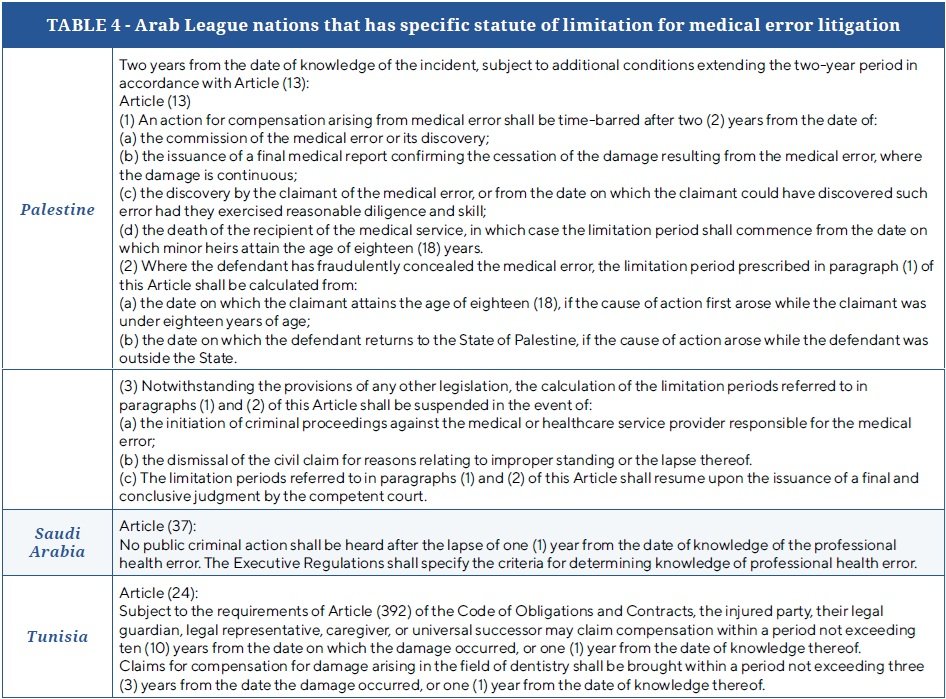
Regarding the medical error litigation process, only 9 out of 22 (40%) countries prohibit the arrest of the healthcare provider or interrogation by the prosecutor for a claim regarding a medical error or professional misconduct before a professional committee examines the allegation and confirms the occurrence of the medical error, [Table 3] list the Arab countries that have these specific legislations in this regard as well as the specific article from the medical liability Law. Only 3 out of 22 countries (13.6%) have a statute of limitation for medical error litigation mentioned and specified; the rest did not mention it and, hence, applied the general civil law principles which is 3 years since knowing the medical error or 15-years from the event occurrence, [Table 4], lists the countries that have specific statutes of limitation for medical error litigation, wirth noting Kingdome of Saudi Arabia stipulated statute of limitation on the public criminal action 1 year from the knowledge of the medical error however the civil liability will be following the general civil Law principles. Finally, 3 out of 22 countries (13.6%) mandate the establishment of a registry for medical error claims, including final judicial rulings to facilitate research and inform legislation improvement [Table 5].
Discussion
The study discussion focused on the elements of the comparative study conducted, which are the existence of specific medical liability law, the definition of medical error, the legal responsibility applied to medical error, the process of medical error litigation, and the penalty stipulated on medical error, in addition to the presence of a statute of limitations and presence of medical error registry.
Existence of specific medical liability law
Upon reviewing the medical liability legislation in the LAS countries, it was observed that many countries still lack specific laws to address medical liability, instead relying on civil and penal codes to handle allegations of medical error. There are two internationally recognized legal systems: the Civil Law and the Common Law. Traditionally, the literature describes customary and religious legal systems; however, these are rarely standalone and are usually integrated within the civil law system, which can then be referred to as a hybrid legal system. The LAS countries can be described as hybrid, as they adopt the Civil Law system in addition to applying Sharia principles to both civil and criminal legal frameworks [14]. The Civil Law system stems back to the Roman Empire and developed in Europe, the Ottoman Empire, and most of the world except North America and Britain. It is based on several theories and principles, one of which is legal positivism, which states that Law is a set of rules and norms set by the legislator [15, 16]. Then, the systematization of legislation theory, where similar law rules are consolidated in a specific code, becomes the primary source of legislation and paves the way for its implementation, guiding legal policies in that field [17]. The third principle of the civil legal system is that it is an inquisitorial system based on extensive pre-trial investigations to ascertain the truth where the judge is empowered to oversee the investigation and interrogation process. Such principles ensure that innocent people are not brought to trial [18]. In the civil legal system, the Civil Code is considered the primary source of legislation where general principles are laid out and referred to whether the case is civil or criminal. The civil code can be supplemented by specialized statutes such as consumer protection law, labor law, and medical liability law [19]. Having special statutes provides clear and specific definitions of terminology, which enhances legal certainty when adapting legal principles to the subject. In addition, specialized statutes offer a deeper understanding of the legal principles pertinent to the field, as penalties are tailored to enhance the field and address its challenges. Lastly, it may lead to increased efficiency in the judicial process, as all sets of rules are consolidated into a single statute [20].
The definition of medical error
Few LAS countries that had medical liability laws did not define medical error. LAS countries that had definitions of medical error, it was noted that all of them were based on the concept of negligence; some countries provided detailed descriptions of acts or omissions that constitute negligence, while others offered a more general definition. In addition, in Law a person is liable for negligent act only if it results in damages (Tort) and a causation relationship between the act and the damage can be established. When examining medical error definitions in LAS countries, some included damages in the definition while others focused on describing negligence and did not mention that it must cause damage to the patient which can be confusing to medical liability experts when assessing presence or absence of medical error from legal point of view [21]. Overall, medical liability in LAS countries is viewed under ‘Tort’ rather than contract liability principles. In Legal literature “Tort” is defined as an act of civil wrong done to another violating a protected right and resulting in damage or harm [22]. Adhering to Tort principle when addressing medical errors is consistent with most of the international legislation except for France, which shifted from tort principle to contractual liability in 1936. However, in 2002 patient rights law changed from contractually based liability to a specific independent legal regime structured as a combination of both Tort principle and contract [23]. The LAS countries share similar religious and cultural backgrounds, which effectively unify their understanding of errors in general, as well as the consequent legal liability and penalties for individuals who commit an error. Therefore, having a unified definition of medical error is possible and helpful in easing communication among healthcare professionals and policymakers, as no internationally agreed-upon definition currently exists [3, 24]. The United States Institute of Medicine defined medical error as “the failure of a planned action to be completed as intended or the use of an incorrect plan to achieve an aim”. Therefore, it is a failure, not necessarily due to negligence. However, realizing that despite being diligent, humans are error-prone and, hence, may still fail to enact a concise plan or that the plan itself may not be the most optimal for that patient [25, 26]. Not all medical errors in the United States warrant legal litigation, only medical malpractice, in another word, all medical malpractice involve medical error, but not all medical error are medical malpractice [3]. The definition of medical error in the United States aligns with the Islamic Fiqh of fault, which is “an act that, through ignorance, deficiency, or accident, departs from or fails to achieve what should be done”, referred to as “Galat, or Gala غلط" and scholar Ibn Manthoor called it “Mistake” [27, 28, 29]. On the other hand, Neglicance based error or fault (medical malpractice in USA) -referred to as “Khatt’a” in Arabic- is defined as “an error or defect in judgment or conduct that deviates from prudence or duty due to inattention, incapacity, perversity, bad faith, or mismanagement and may result in harm to another person and may be intentional or negligent.” [26].
Therefore, LAS countries need to establish two definitions one of “Galat, or Gala غلط , 6 ” which is errors that occurs even when utmost care and diligence are exercised yet harm may occur despite taking all necessary precautions to prevent it which must be investigated at hospital or system level to improve quality of medical care provided and hold no legal liability. The second definition is of “Khatt’a” , خطأ which is a fault that is the result of negligence and a breach of the duty of care, and result in hard and necessitate legal liability. Hence, the use of “medical fault” as Englis term ( خطأ طبي )is more accurate to reflect negligence-based medical malpractice than “medical error” - غلط طبي. It is essential to accurately define these two definitions as one implies legal liability while the other does not, as not doing so can hinder the provision of necessary care due to fears of litigation. For instance, in emergency medicine, physicians frequently make rapid decisions under conditions of incomplete information. In such contexts, overlooking a diagnosis when clinical picture is unclear or previous patient data (history) may not be available or decisions are made under service and time pressure may be miss interpreted as medical error where in reality its explained by “reasonable person standard” for any physician working under similar circumstances that day, therefore emphasis on reasonable person standard which account for time pressure or clinical uncertainty of decision making in the Emergency Department or the Operating Room need to be clarified in the medical error definition or the medical liability Law illustrative document that follows . This illustrates how legal frameworks governing medical error may have unintentional practical consequences on clinical behavior, risk-taking, and ultimately patient safety if not detailed and clarified. Perhaps another approach might be to drop the medical error terminology and use the Kuwait approach of defining when physician is legally liable which include deviation from standard of care and neglecant which is like the United State approach where they use (medical malpractice) as a term rather than medical error.
The legal responsibility applied to medical error
Regarding legal responsibilities and penalties for medical error, all LAS countries impose civil, criminal, and administrative penalties on healthcare providers found to be negligent. The criminal liability of medical professionals for medical errors dates to ancient times, when the medical profession was not yet fully established. Doctors were often viewed with suspicion, likened to witches or individuals with malevolent intentions rather than being regarded as healers [30]. Punishment in the penal code is based on two philosophical theories, utilitarian and retributive theories. According to utilitarian theories, punishment is justified by its deterrence of criminal behavior and by its other beneficial consequences for both individuals and society. According to the utilitarian theory, criminal acts are penalized and punished to deter individuals and the community from committing crimes, thereby protecting society [31]. This does not apply to medical errors, as penalizing professionals who commit medical errors while caring for and serving patients holds no benefit to the patient, the community, or the healthcare practice. Indeed, it may be harmful to the community, as healthcare providers may be deterred from taking calculated risks in managing patients [32, 33]. The retributive theory involves three criteria, all of which must be met; first, a person may be punished only if the wrong act is voluntary. Second, the punishment must be equal to the damage caused, and third, the punishment must be justified on moral and just grounds [34]. Therefore, retributive theory also cannot justify punishment for medical error, given that it is not voluntary, nor is it moral or justifiable. In addition, two basic principles in criminal law do not apply to criminalizing medical errors, which are the “benefit of doubt” rule and the “acquittance is the rule.” The “benefit of the doubt” is a cornerstone of criminal law and necessitates that if reasonable doubt exists regarding the guilt of the accused (the healthcare professional), they should be accorded the benefit of that doubt and not deemed guilty as it must be proven that the accused is guilty “beyond all reasonable doubts”, in addition, the burden of proof is on the prosecution and the plaintiff not on the accused [35]. This, coupled with the legal principle that states “acquittance is the rule,” makes it challenging to criminalize medical errors. First, determining negligence is often subjective; thus, medical experts and professional committees cannot confirm whether negligence occurred solely based on objective evidence but rather through indirect signs. In addition, negligence is not exclusively the responsibility of the individual; there are indeed many confounding factors that may contribute to healthcare provider negligence, such as long working hours, working during non-social hours, inadequate administrative support processes, and a lack of social or collegial support. Therefore, imposing criminal liability on medical errors requires examination by LAS countries considering addressing medical errors under tort principle and sparing criminal penalties for healthcare professionals on actions that they are explicitly prohibited from undertaking, such as practicing without a license, performing illegal abortions, assisting patients to die, or facilitating the misuse of controlled drugs and other similar prohibited actions [36]. On the other hand focusing on compensating patients for the damage they suffer via valuable Civil Award to help them recover the damage if possible or mange it, is more beneficial for the patient and their families than punishing the healthcare professional criminally [25]. Additionally, the imposition of appropriate corrective disciplinary penalties will ensure that healthcare professionals are deterred from negligence [37]. By focusing on system-level and individual-level improvements rather than punitive measures against healthcare providers, the system can avoid negative consequences that may discourage doctors from managing high-risk patients or offering alternative treatment options that may have benefits not commonly recognized [27]. Conclusively, whether we consider the utilitarian or retributive theory or consider basic criminal law principles, “the benefit of doubt” rule and the “acquittance is the rule,” it is found that criminally charging a healthcare professional neither serves the public nor the patient nor the healthcare provider [28].
The process of medical error litigation
The process of medical error litigation across LAS countries is diverse. Only 9 of the 22 countries with medical liability-specific legislation state that physicians can't be brought to court except after a medical error is proven by the medical committee's final report (Table 3). The UAE Medical Liability Law explicitly describes the process where the claim investigation is purely administrative, with a professional medical liability committee investigating the claim to determine if a medical error occurred. Both parties, the claimant and the defendant, have 30 days to appeal, and afterward, another independent committee (the higher committee of medical liability) re-investigates the case and issues their decision administratively; their decision counts as final where if no medical error is found, claimant can’t file a case in court. In many LAS countries, where the medical malpractice litigation process is not outlined in law, patients can approach a prosecutor to file a claim, and the prosecution initiates an investigation involving healthcare workers before the medical error is proven. The role of the professional committee only comes into play once the case is referred to the court. During the process of prosecution investigations, healthcare professionals may be detained for days or weeks, which can be demoralizing to both the healthcare worker under investigation and their colleagues, as well as to the healthcare community in the perspective country, especially if the care provided meets the standards of care. Such harsh criminal investigation processes may harm medical practice, as doctors may be deterred from taking risks in managing high-risk patients, fearing criminal charges if complications arise [38]. Here is another area of medical liability reform for LAS countries which is preventing any prosecution or judicial litigation or investigation prior to confirming medical errors that necessitate legal liability.
The presence of a statute of limitations
Out of all the LAS countries' legislations reviewed, only Saudi Arabia, Tunisia and Palestine have explicitly stipulated a statute of limitations for medical error litigation. The absence of such a provision leaves the timeframe open for up to 15 years, according to standard rules of civil law. However, this extended timeframe becomes increasingly unrealistic over time due to the rapid advancement and changing standards of care, diagnostic methods, and treatment modalities. Implementing a statute of limitations would ensure a more realistic and fair approach to addressing medical error claims within a reasonable timeframe [3, 39]. In addition, the longer the time frame, the more difficult it is to perform robust investigations as most hospitals keep records for up to 5 years only; hence, evidence might be lacking if investigations are conducted on incidents that occurred longer than 3-5 years [40, 41].
Recommendations
Based on the comparison conducted, the review and analysis of current legislation regarding LAS Medical Liability of medical errors, the study suggests the following six legislative reform initiatives:
1- To Consider adopting two definitions of medical error, one that is negligence based and imply legal liability, and another that is not negligent based and does not imply legal liability. They can consider using the term “fault” instead of error for negligence based medical error and call it (medical fault) “Khatt’a” (a medical error that infers legal liability, ie; medical malpractice) and use the term “Galat” medical errors which is ignorance-based and can occur despite exercising due diligence and does not imply legal liability.
2- To provide an objective description of actions that will be considered negligence.
3- To establish a unified framework for non-criminal liability of negligence-based medical error, reserving criminal liability for acts explicitly prohibited by law such as non-medical abortion, euthanasia, refusal to treat a patient in case of emergency and other similar actions.
4- To adopt a unified statute of limitations to ensure a reasonable timeframe for medical error litigation.
5- To create a centralized database within the LAS that records all medical error litigations, which can be utilized for research and educational purposes, promoting knowledge sharing and improving the healthcare system collectively.
Strengths and limitations
The research methodology stands out as the first comprehensive examination of medical liability legislation in the LAS countries. The proposal put forward, encompassing a unified definition of medical error, consistent principles for penalties, and other essential considerations, is poised to foster collaboration and improve healthcare provision among these nations. It is crucial to acknowledge the study's limitations. This research did not address administrative, disciplinary, and restorative aspects of medical error in detail, and we suggest these as areas for future research. This research heavily relied on online searches and the insights gathered from the authors' network of colleagues practicing in different Arab countries. Consequently, the most up-to-date medical liability legislation, as well as any updates that may not have been published online, may have been missed and not included. While formal communication with each country’s Ministry of Health could have provided more accurate information, the time constraints and logistical complexities led the authors to opt for an initial online review. Future studies are needed to build upon this groundwork, potentially led or facilitated by the Arab Health Council, to ensure a more robust and comprehensive exploration of medical liability in the LAS countries.
Conclusion
The League of Arab States shares a common cultural and legal background, presenting an opportunity for harmonizing medical liability legislation related to medical errors. By adopting a unified definition of medical error, applying civil and disciplinary non-criminal penalties, and establishing a unified statute of limitations in addition to other reform initiatives, these countries can positively impact their healthcare systems. Lastly, the study proposes that this review be conducted with the support of the Arab Healthcare Council to ensure the participation of all countries and achieve a comprehensive and accurate understanding of medical liability related to medical errors across the League of Arab States.
Authors' contributions
Both authors contributed equally to the manuscript and study. Both authors have a Bachelor of Laws and are interested in medical liability in addition to legislation related to healthcare. Both authors serve as medical examiners for medical malpractice cases in their respective jurisdictions of practice.
Declarations
Use of Artificial Intelligence declaration
Authors would like to declare that Chat GPT was used to translate Law articles and Law titles from Arabic to English as many of the Legislations reviewed are available in Arabic and not available in English.
Ethics approval and consent to participate
This is a descriptive comparative study that compares published legislation; therefore, no ethics approval or consent was required.
Consent for publication
Not applicable
Availability of data and materials
All legislation and literature reviewed are referenced and available upon request.
Competing interests
Both authors declare no competing interests.
Funding
No funding was received for this study.
References
1. “The Arab League,” Council on Foreign Relations. Accessed: Jun. 30, 2023. [Online]. Available: https://www.cfr.org/backgrounder/arab-league
2. “Application Of Islamic Law In The Middle East - International Trade & Investment - Worldwide.” Accessed: Jun. 30, 2023. [Online]. Available: https://www.mondaq.com/international-trade-amp-investment/52976/application-of-islamic-law-in-the-middle-east
3. Bal, S. B. (2009). An introduction to medical malpractice in the united states. Clinical Orthopaedics & Related Research, 467(2), 339-347. https://doi.org/10.1007/s11999-008-0636-2
4. emhj, “Delivery of health services in Arab countries: a review,” World Health Organization - Regional Office for the Eastern Mediterranean. Accessed: Jun. 30, 2023. [Online]. Available: http://www.emro.who.int/emhj-volume-18-2012/issue-12/08.html
5. D. Vanderpool, “The Standard of Care,” Innov Clin Neurosci, vol. 18, no. 7–9, pp. 50–51, 2021.
6. “Algeria-Health law,” P4H Network. Accessed: Mar. 17, 2025. [Online]. Available: https://p4h.world/fr/documents/algerie-loi-relative-a-la-sante/
7. Decree-Law No. (7) for the year 1989 On the practice of medicine and dentistry. 1989. [Online]. Available: https://nhra.bh/Departments/HCP/Regulations/MediaHandler/GenericHandler/documents/departments/LAU/HCP/HCP000_Law_Decree-Law%20No.%20(07)%20for%20the%20year%201989%20On%20the%20Practice%20of%20Medicine%20and%20Dentistry%20Professions_English.pdf
8. https://www.amr.gov.kw, “Law Number 70 of the Year 2020,” Authority for medical responsibility. Accessed: Mar. 17, 2025. [Online]. Available: https://www.amr.gov.kw/law70-2020
9. Law no. 240 dated October 22, 2012 Amending Law No. 288 of February 22, 1994. Code of Medical Ethics. 2012. [Online]. Available: https://www.aub.edu.lb/fm/shbpp/Documents/New-Code-of-Medical-Ethics-text-ENGLISH-.pdf
10. Benomran, F. A. (1994). Medical responsibility in the libyan law. Medical Law International, 1(3), 289-300. https://doi.org/10.1177/096853329400100305
11. “Royal Decree 75/2019 Promulgating the Law Governing the Practice of the Medical Profession and Allied Health Professions – Decree.” Accessed: Mar. 17, 2025. [Online]. Available: https://decree.om/2019/rd20190075/
12. “United Arab Emirates Legislations | Federal Decree-Law Concerning Medical Liability.” Accessed: Mar. 18, 2025. [Online]. Available: https://uaelegislation.gov.ae/en/legislations/1192
13. “قانون العقوبات رقم (16) لسنة 1960م.” Accessed: Jun. 30, 2023. [Online]. Available: https://maqam.najah.edu/legislation/33/
14. “Law and legal systems in the Arab Middle East: beyond binary terms of traditionalism and modernity,” IEDJA. Accessed: Mar. 21, 2025. [Online]. Available: https://iedja.org/en/law-and-legal-systems-in-the-arab-middle-east-beyond-binary-terms-of-traditionalism-and-modernity/
15. Hariri, A., Unggul, W. S., & Arifin, S. (2022). A critical study of legal positivism as a legal system in a pluralist country. KnE Social Sciences. https://doi.org/10.18502/kss.v7i15.12131
16. “(PDF) Legal Positivism: Early Foundations.” Accessed: Mar. 20, 2025. [Online]. Available: https://www.researchgate.net/publication/228278311_Legal_Positivism_Early_Foundations
17. Ivanchenko, O. (2022). The essence and legal nature of the systematization of legislation. Analytical and Comparative Jurisprudence, 23-27. https://doi.org/10.24144/2788-6018.2021.04.4
18. fromiti, “Organized Crime Module 9 Key Issues: Adversarial versus Inquisitorial Legal Systems.” Accessed: Mar. 20, 2025. [Online]. Available: //www.unodc.org
19. “Civil Code - an overview | ScienceDirect Topics.” Accessed: Mar. 18, 2025. [Online]. Available: https://www.sciencedirect.com/topics/social-sciences/civil-code
20. S. Allen, “The German Civil Code and the Development of Private Law in Germany | Oxford University Comparative Law Forum.” Accessed: Mar. 20, 2025. [Online]. Available: https://ouclf.law.ox.ac.uk/the-german-civil-code-and-the-development-of-private-law-in-germany/
21. Nagieb, M., El-Gallad, G., Ghaleb, S., et al. (2023). Medico legal aspects of medical malpractice dead cases in cairo and giza governorates from 2014–2015. Egyptian Journal of Forensic Sciences, 13(1). https://doi.org/10.1186/s41935-023-00350-5
22. Y. Ronquillo, M. B. Pesce, and M. Varacallo, “Tort,” in StatPearls, Treasure Island (FL): StatPearls Publishing, 2023. Accessed: Jul. 06, 2023. [Online]. Available: http://www.ncbi.nlm.nih.gov/books/NBK441953/
23. F. G’Sell-Macrez, “Medical Malpractice and Compensation in France, Part I: The French Rules of Medical Liability since the Patients’ Rights Law of March 4, 2002,” Chicago-Kent Law Review, vol. 86, no. 3, p. 1093, Jun. 2011.
24. Anderson, J. G., & Abrahamson, K. (2017). Your health care may kill you: medical errors. Studies in Health Technology and Informatics. https://doi.org/10.3233/978-1-61499-742-9-13
25. Math, S., & Chandra, M. (2016). Progress in medicine: compensation and medical negligence in india: does the system need a quick fix or an overhaul?. Annals of Indian Academy of Neurology, 19(5), 21. https://doi.org/10.4103/0972-2327.192887
26. “fault definition · LSData.” Accessed: Jul. 01, 2023. [Online]. Available: https://www.lsd.law/define/fault
27. I. of M. (US) C. on O. G. M. T. (Resident) H. and W. S. to I. P. Safety, C. Ulmer, D. M. Wolman, and M. M. E. Johns, “System Strategies to Improve Patient Safety and Error Prevention,” in Resident Duty Hours: Enhancing Sleep, Supervision, and Safety, National Academies Press (US), 2009. Accessed: Nov. 29, 2023. [Online]. Available: https://www.ncbi.nlm.nih.gov/books/NBK214937/
28. E. Monico, R. Kulkarni, A. Calise, and J. Calabro, “The Criminal Prosecution of Medical Negligence,” The Internet Journal of Law, Healthcare and Ethics, vol. 5, no. 1, Dec. 2006, Accessed: Jul. 01, 2023. [Online]. Available: https://ispub.com/IJLHE/5/1/5237
29. H. A. Albarak, “Medical Mistakes through The Islamic Sharia? and Law,” Systematic Reviews in Pharmacy, vol. 12, no. 8, pp. 2830–2835, Mar. 2021.
30. Mandilara, P., Galanakos, S. P., & Bablekos, G. (2023). A history of medical liability: from ancient times to today. Cureus. https://doi.org/10.7759/cureus.41593
31. Nathan, C. (2020). Punishment the easy way. Criminal Law and Philosophy, 16(1), 77-102. https://doi.org/10.1007/s11572-020-09549-2
32. Gharaibeh, Z. (2022). The impacts of applications of criminal law on medical practice. Medical Archives, 76(5), 377. https://doi.org/10.5455/medarh.2022.76.377-382
33. Smith, S. R. (2022). Criminal liability: what are the risks for medical professionals?. OBG Management, 34(12). https://doi.org/10.12788/obgm.0239
34. “RETRIBUTION AND THE THEORY OF PUNISHMENT | Office of Justice Programs.” Accessed: Mar. 25, 2025. [Online]. Available: https://www.ojp.gov/ncjrs/virtual-library/abstracts/retribution-and-theory-punishment
35. “burden of proof,” LII / Legal Information Institute. Accessed: Mar. 28, 2025. [Online]. Available: https://www.law.cornell.edu/wex/burden_of_proof
36. “Medical Liability: Canada, England and Wales, Germany,” Library of Congress, Washington, D.C. 20540 USA. Accessed: Mar. 18, 2025. [Online]. Available: https://tile.loc.gov/storage-services/service/ll/llglrd/2015372201/2015372201.pdf
37. MELLO, M. M., STUDDERT, D. M., KACHALIA, A. B., et al. (2006). “Health courts” and accountability for patient safety. The Milbank Quarterly, 84(3), 459-492. https://doi.org/10.1111/j.1468-0009.2006.00455.x
38. S. Sharmma, “Medical negligence : criminal, consumer and tort,” Uttarakhand Judicial and Legal Academy. [Online]. Available: https://ujala.uk.gov.in/files/Vol%204/Article_10_1.pdf
39. A. H. Coleman, “Malpractice and the Statute of Limitations,” J Natl Med Assoc, vol. 52, no. 1, pp. 71–72, Jan. 1960.
40. T. Sridharan, “Understanding the Statute of Limitations Medical Malpractice Cases,” 1800THELAW2. Accessed: Mar. 21, 2025. [Online]. Available: https://www.1800thelaw2.com/resources/medical-malpractice/statute-of-limitations/
41. “Statute of Limitations - an overview | ScienceDirect Topics.” Accessed: Mar. 21, 2025. [Online]. Available: https://www.sciencedirect.com/topics/social-sciences/statute-of-limitations